NetStat
The netstat command is available from within the Command Prompt in most versions of Windows including Windows 10, Windows 8, Windows 7, Windows Vista, Windows XP, Windows Server operating systems, and some older versions of Windows too.
When you run the netstat command, it gathers information about network sockets, protocols, and connections by querying the systems networking stack. The process typically involves:
Reading Network Data:
- netstat accesses the system's kernel to collect real-time network statistics.
- It retrieves information on active connections (both incoming and outgoing).
Processing Connection States:
- It determines the state of TCP connections (e.g., ESTABLISHED, LISTEN, TIME_WAIT).
- It identifies open ports and their associated processes.
Displaying Results:
- The gathered data is formatted into readable tables.
- It includes information like local/foreign IP addresses, port numbers, connection states, and protocols.
Netstat allows you to display statistics about your Ethernet interface. If any errors are indicated in the display, you might have problems with your network connection that are slowing the network down. If the error packets approach 1% of the total number of packets, something is probably wrong with your NIC or physical interface.
- Open a new command prompt by pressing the Windows key along with R and then type cmd. (Note, the windows key is between CTRL and ALT on left of the keyboard) OR you can also simply type the command cmd into the search bar at the bottom ribbon of the Windows desktop to run the Command Prompt (see below).
- In the command prompt, type in netstat to list all current network connections, not just inbound but outbound as well.

- You should see a list of connections listed. This can be useful for finding live network attacks.
- Type in netstat -? to see options with this command. You should see -a, -e and others.

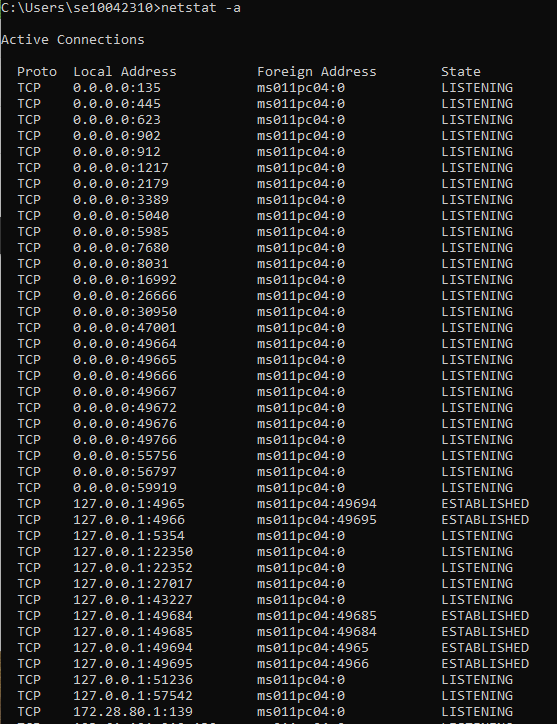
- Now type in netstat -a
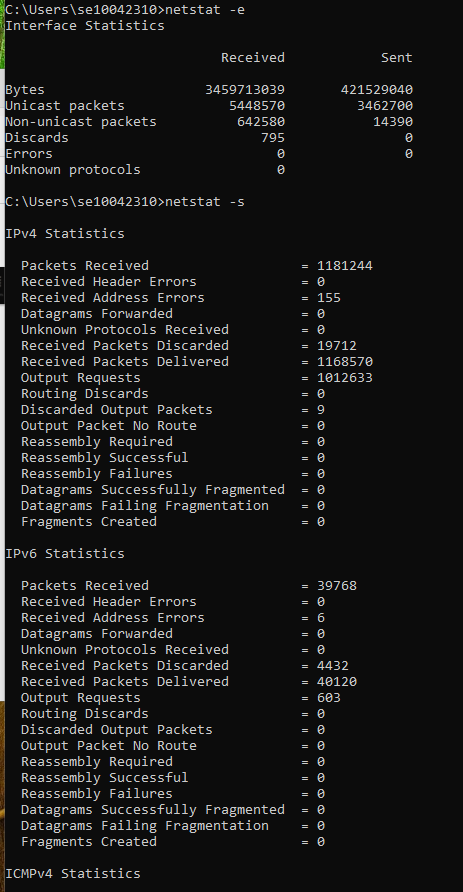
- Type in netstat -e. These statistics include the number of bytes and packets received and sent through the Ethernet interface.
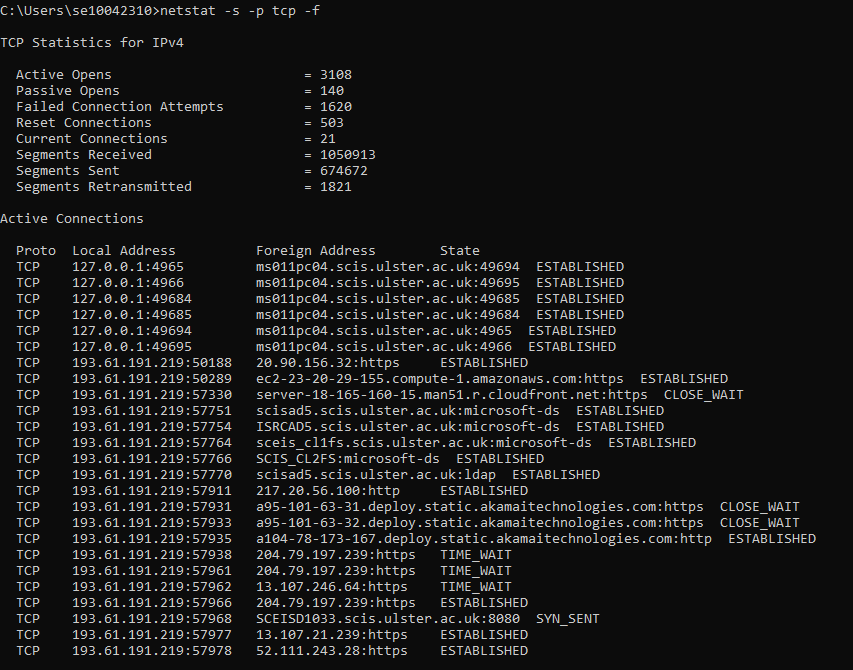
- Type in netstat -f. This show statistics for all active connections.
- Type in netstat -r. The command netstat -r displays the routing table of the system, which includes information about how network traffic is directed. It helps network administrators understand how packets are routed through the system. Do not worry for now if you do not understand it. Just be aware that the gateway is the router used by the lab to send you packets onwards to the Internet.

- To see statistics for all protocols, type netstat -s and press Enter.
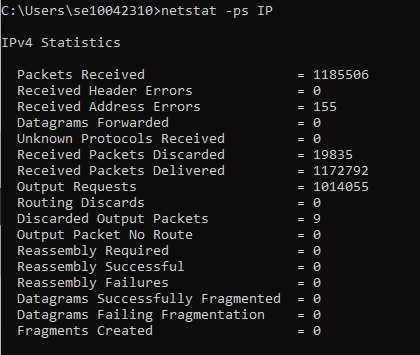
- To limit the display to just IP statistics, type netstat -ps IP and press Enter.
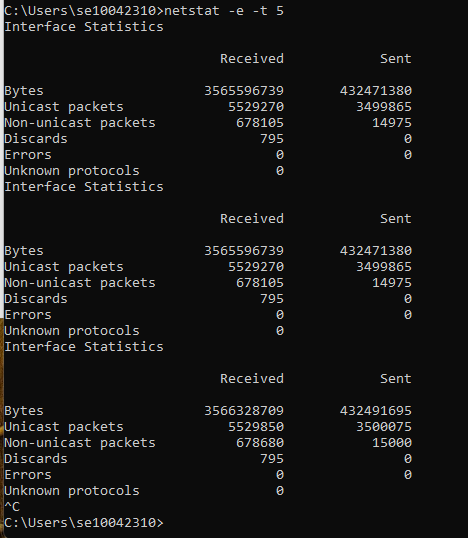
- To see your active network statistics updated every 5 seconds, type netstat -e -t 5 and press Enter. You can press Ctrl+C to stop the process.
- Type netstat -o. This shows active TCP connections, but it also displays the corresponding process identifier [-o] for each connection so you can determine which program on your computer initiated each one.
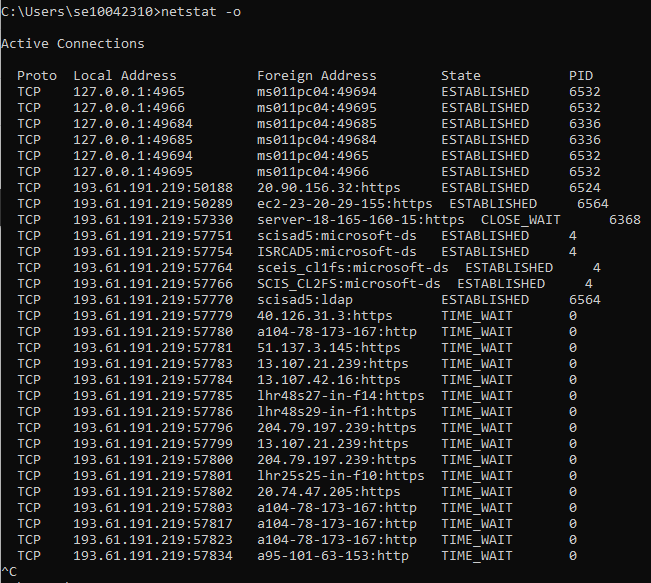
- Pay attention to the PID column. In somes cases, the PIDs are all the same, meaning that the same program on your computer opened these connections. However, to determine what program is represented by the PID of say 2948 on your computer, all you have to do is open Task Manager, click on the Processes tab, and note the Image Name listed next to the PID your are looking for in the PID column.
The netstat command with the -o option can be very helpful when tracking down which program is using too big a share of your bandwidth. It can also help locate the destination where some kind of malware, or even an otherwise legitimate piece of software, might be sending information without your permission.
Note: While this and the previous example were both run on the same computer, and within just a minute of each other, you can see that the list of active TCP connections is considerably different. This is because your computer is constantly connecting to, and disconnecting from, various other devices on your network and over the Internet.
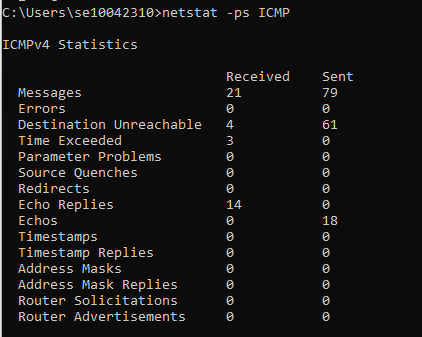
- To display ICMP information, type netstat -ps ICMP and press Enter. A variety of ICMP message types are displayed along with how many of each type of message were received and sent. Most, if not all, will be Echo and Echo Reply messages.

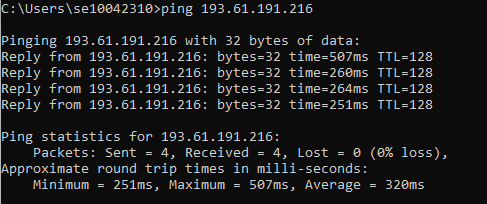
- Ask a fellow student for their IP address. Then use that e.g. Type ping 193.61.191.71 and press Enter. Note, this command may generate ICMP Destination Unreachable messages. You should however see something similar to below.
- To see whether the number of Destination Unreachable messages has increased, type netstat -ps ICMP and press Enter. Note, in this instance, the number of messages received has changed from 3 to 21 and messages sent from 63 to 79 (as shown earlier in step 13).
- To display your computer’s routing table, type netstat -r and press Enter. Every computer has a routing table it uses to decide which interface to send packets to. The first entry lists the network destination as 0.0.0.0, which is the entry for your default gateway.
- Finally, type netstat -s -p tcp -f. Here we wish to see protocol specific statistics [-s] but not all of them, just TCP stats [-p tcp]. We also want the foreign addresses displayed in FQDN format [-f]. Please scroll up in the command windows to see TCP stats displayed before the list of active connections was created.